Progress is good on reverse engineering the assembly code, only about 500 instructions to go. Unfortunately these are in at the rather gnarly core of the instruction interpretation and emulation, so progress is a bit slower.
Along the way I have found one or two little titbits (tidbits?) of behaviour that are quite interesting.
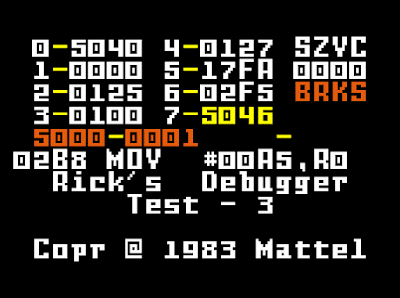
Secondly, there is some special logic that is applied to incrementing the value in R7. If R7 is selected and then incremented using the 9 key on the right keypad, a partial decode of the opcode is done and this is used to skip over any operands associated with an instruction. Clearly this is an attempt to prevent users accidentally starting execution in the middle of an instruction. For example, if we fire up Debugger Test-3 and highlight R7:
Then hit the 9 key on the right keypad once to increment the register value, the value of R7 increases by 2, rather than 1, ensuring that we skip over the operand of the 2 decle MVII instruction to the start of the next INCR instruction:
Again, a cool usability feature.
So far there is no sign of what the distinction is between the two memory inspectors. When both reading and writing the fields the behaviour seems to be the same. Strange.
Anyway, onward...


Comments
Post a Comment